Pivot tables are tools in Microsoft Excel or Google Sheets that enable you to calculate, summarize, and analyze data for comparisons, patterns, and trends. Marketers use pivot tables to give insight into a company’s data that can be used to help marketing teams increase brand awareness and drive more sales. To view the data analyzed in this blog post, use this link.
Creating a Pivot Table
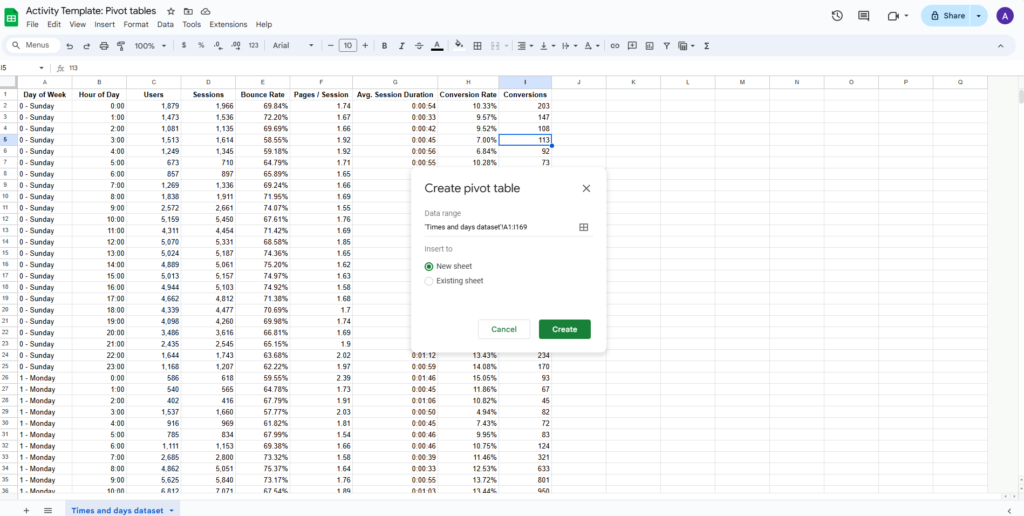
- Click anywhere in the data set. Then go to Pivot Table in the Insert tab. Afterward, a pop-up titled Create Pivot Table will show up on the screen. Ensure the whole data set is included in the data range. Also, ensure that you select the new sheet option is selected for the insert to option. Finally, click the green create button.
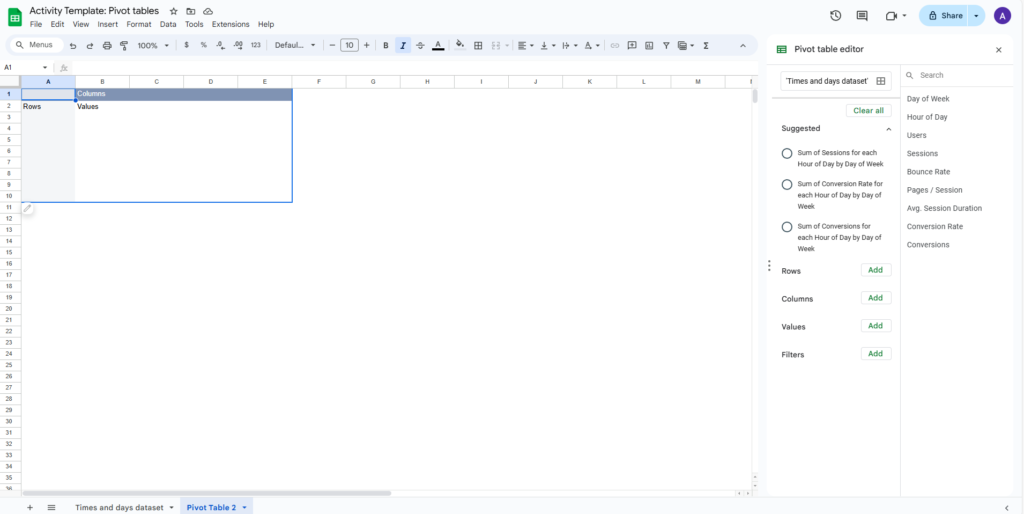
- This results in the Pivot Table editor being visible on-screen. If, by any chance, you exit the Pivot table editor and need to bring the editor back on-screen, there is a small pencil icon below the pivot table. Click that pencil icon to bring the pivot table editor back on screen.
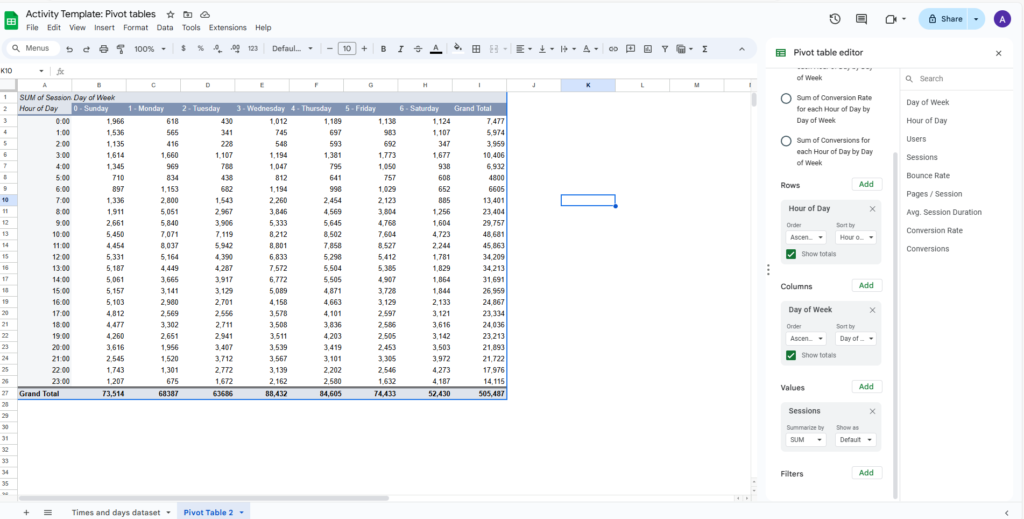
- Click on the add button next to rows. Here, add the hour of the day. Make sure the order is ascending and the show totals is checked.
- For the columns, add day of the week to the pivot table. Make sure the order is ascending and that show totals is checked.
- For the values, we will add the session data here. Add any data you want to analyze. However, ensure that only one subset of the data is included in the values section. Ensure the summarized by option is set to SUM, and the Show as option is set to default. Finally, the pivot table should look like the picture below.
Formatting the pivot table
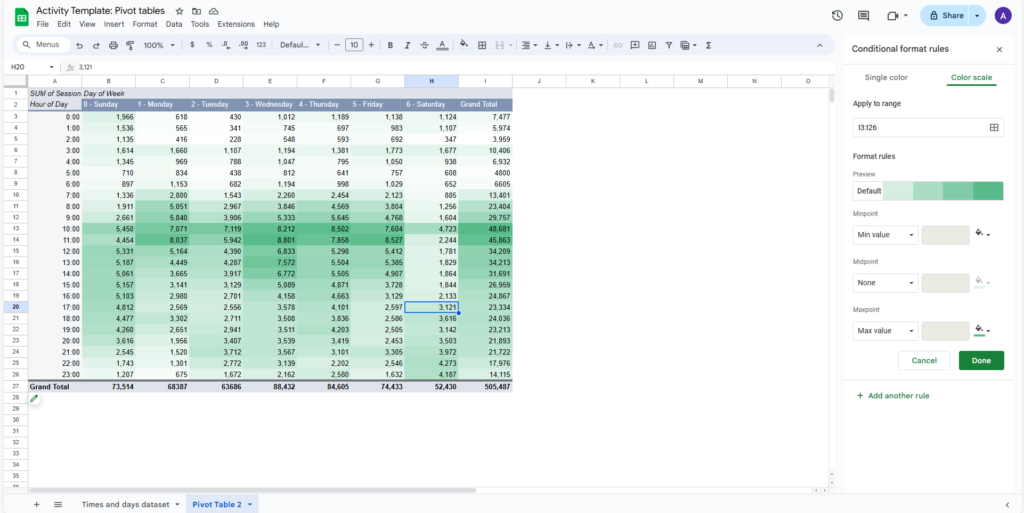
- Close the pivot table editor. Select all the session data except those in the grand total column. Go to the Format tab and select conditional formatting. Select the color scale tab in the conditional format rules. Lastly, select a color scheme. It is recommended that the color scheme shades the lowest values in white and the highest in green, yellow, or red. The result will be something similar to what is shown below.
- Repeat this process to create as many pivot tables as necessary.
Analysis of the sessions pivot table
To sum everything up, the pivot table data clearly shows that most sessions occur between 8:00 a.m. and 6:00 p.m. Additionally, weekdays have more sessions than weekends, especially Saturdays, which have the least sessions for any day. The time period with the most sessions every day of the week is between 10:00 a.m. – 1:00 p.m. Lastly, there is more session data on weekends between 12:00 a.m.-5:00 a.m.
Analysis of the conversions pivot table
Most conversions happen between 8:00 a.m. and 8:00 p.m. Significantly more conversions occur on weekdays than on weekends. The hotspots for conversions occur between 8:00 a.m. – 4:00 p.m. during weekdays. Saturday has the lowest conversions of any day of the week. However, a conversion hotspot occurs on Saturday between 5:00 p.m. and 12:00 a.m. Additionally, On Sunday, a conversion hotspot occurs between 10:00 a.m. and 9:00 p.m.
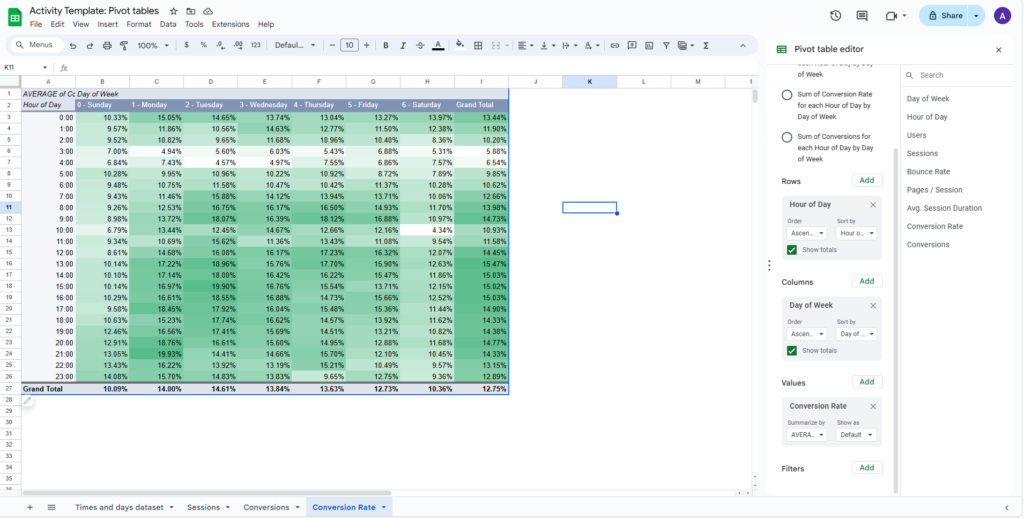
Analysis of the conversions rate pivot table
The conversion rate hotspots occur:
- Sunday between the hours of 6:00 p.m. and 12:00 a.m.
- Monday between the hours of 8:00 a.m. and 11:00 a.m.
- Monday between the hours of 12:00 p.m. and 1:00 a.m.
- Tuesday between the hours of 7:00 a.m. and 10:00 a.m.
- Tuesday between the hours of 11:00 a.m. and 1:00 a.m.
- Wednesday between the hours of 12:00 a.m. and 5:00 p.m.
- Thursday between the hours of 5:00 a.m. and 10:00 p.m.
- Friday between the hours of 7:00 a.m. and 10:00 a.m.
- Friday at noon.
- Friday between the hours of 1:00 p.m. and 3:00 p.m.
- Friday between the hours of 4:00 p.m. and 6:00 p.m.
- Saturday between the hours of 5:00 a.m. and 10:00 p.m.
To view more blog posts and learn more about digital marketing, SEO, Divi, or other related topics, visit our website’s blog section. Fill out our contact form now to contact us and get a FREE analysis of your website.